
2-D Brain Maps
Creating maps of brain function to better understand your brain
Here are a sample of 2-D brain maps which help us to locate sub-optimal brain function. You will see them at your consultation, but we do not use them after that. In terms of progress, we will use more specific data, including learning curve and psychometric testing.

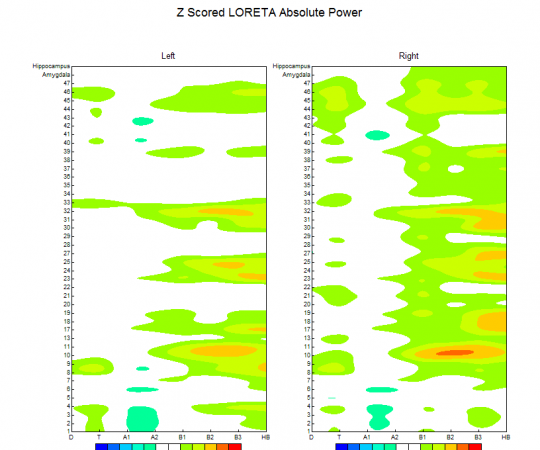
Brain Map at First Visit

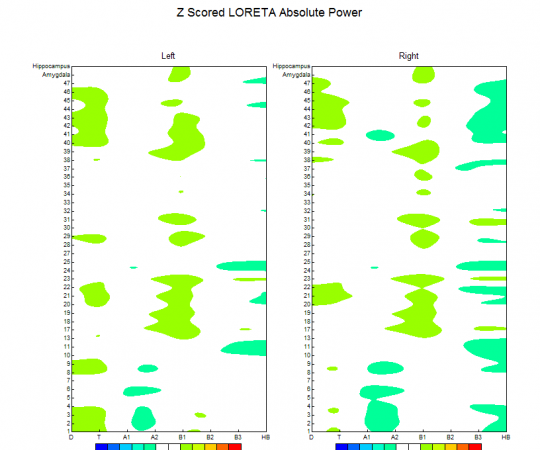
Brain Map after 12 Sessions

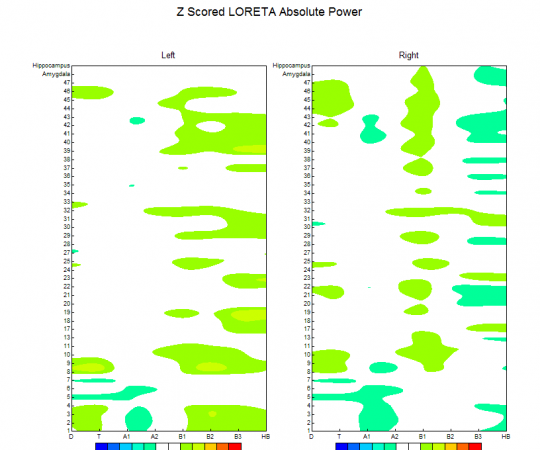
Brain Map after 5 Sessions

Brain Map after 15 Sessions

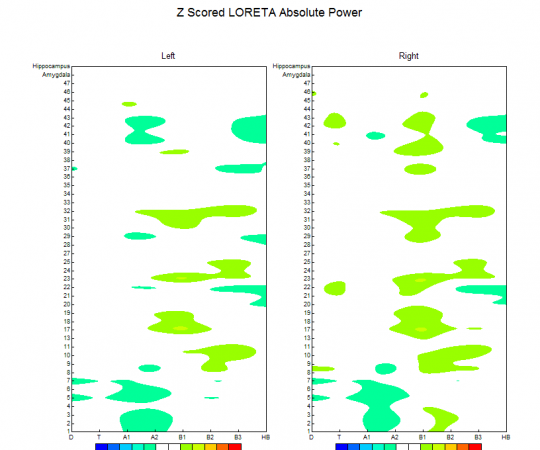
Brain Map after 10 Sessions

3-D Brain Maps
To provide further detail on brain function, we utilise an important tool in Neuroscience called LORETA (this stands for Low Resolution Electromagnetic Tomography). This gives us a clearer picture of what is happening not only at the surface or cortex, but in sub-cortical areas as well, using 3-D rendering. In this client, for example, we can see sub-optimal function in the frontal cortex:

A 3-D model of this functioning allows even more precise localisation of the dysfunctional area at the front of the brain:

A 3-D model of brain function, showing the same areas of areas of deviance as above. These models allow precise localisation of problem areas in the brain.
With this information, we can begin to build a very precise picture of what your brain is doing, and how we might help it to function more efficiently. Remember, if your brain works better, you work better.